You are here

Visualization

The toll of a tragedy

An infographic of the toll of the Ebola outbreak.

Image: An infographic of the toll of the Ebola outbreak.

economist.com - October 31st 2014

The first reported case in the Ebola outbreak ravaging west Africa dates back to December 2013, in Guéckédou, a forested area of Guinea near the border with Liberia and Sierra Leone. Travellers took it across the border: by late March, Liberia had reported eight suspected cases and Sierra Leone six. By the end of June 759 people had been infected and 467 people had died from the disease, making this the worst ever Ebola outbreak.

(VIEW COMPLETE ARTICLE AND FULL SIZE INFOGRAPHIC)


General Topic Tags: 
Problem, Solution, SitRep, or ?: 

Fighting Ebola with Data, Satellites and Drones

Healthcare workers in Sierra Leone spray disinfectant to prevent the spread of the Ebola virus in Kenema, on September 24, 2014.

Image: Healthcare workers in Sierra Leone spray disinfectant to prevent the spread of the Ebola virus in Kenema, on September 24, 2014.

defenseone.com - September 25th, 2014 - Patrick Tucker

Current Centers of Disease Control estimates suggest that the disease could infect more than 1.4 million people by January. To limit Ebola’s spread, researchers need better on-the-ground intelligence about where it’s moving. But the virus’s deadly mortality rate, 70 percent for this strain, makes up-close observation as difficult as gathering data on a deadly human adversary. 

Country / Region Tags: 
General Topic Tags: 
Problem, Solution, SitRep, or ?: 

Here Is How Much You Spend On Electricity In Each State

huffingtonpost.com - August 19th, 2014 - Kevin Short

If you live in Louisiana, you likely use more than twice as much electricity as the average New Yorker does each month. And if you live in Arkansas, you likely pay about half as much as than someone in Vermont does for a unit of electrical power.

The maps below, created using data from the U.S. Energy Information Administration, show how electricity consumption and costs vary across state lines.

(VIEW COMPLETE ARTICLE AND MAPS)

Country / Region Tags: 
General Topic Tags: 
Problem, Solution, SitRep, or ?: 

President Obama Launches Climate Tools Including 3-D Maps

whitehouse.gov

usatoday.com - by Wendy Koch - July 16, 2014

As part of his plan to help U.S. communities prepare for climate change, President Obama is unveiling initiatives Wednesday that include 3-dimensional mapping to better identify flood risks, landslide hazards and coastal erosion. . .

. . . The U.S. Geological Survey is launching a $13 million 3-D Elevation Program to develop advanced mapping that it says could, among other things, make it quicker to update flood maps and easier to find ideal sites for wind turbines and solar panels. It's relying on lidar (light detection and ranging) technology that uses light from lasers to give the elevation of any spot — from the tree tops to the ground.

(READ COMPLETE ARTICLE)

Country / Region Tags: 
Problem, Solution, SitRep, or ?: 

Handheld Terahertz Cameras Could Replace MRI

 submitted by Luis Kun


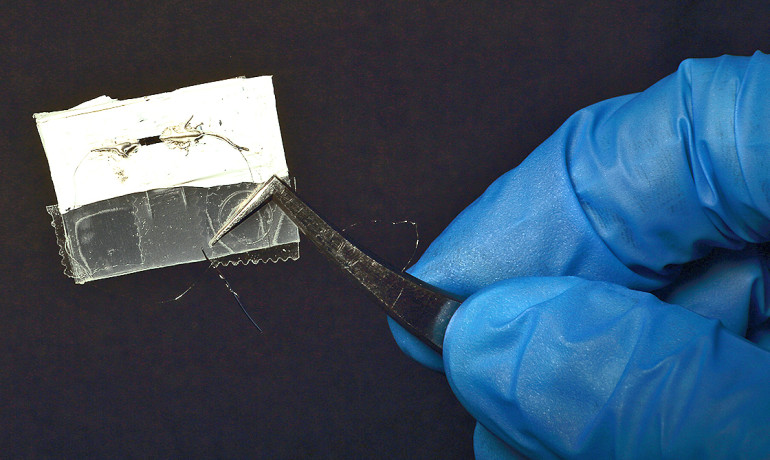
"With this technology, you could conceivably design a handheld terahertz detection camera that images tumors in real time with pinpoint accuracy. And it could be done without the intimidating nature of MRI technology," says Junichiro Kono. (Credit: Sandia National Laboratories)

futurity.org - by Mike Williams-Rice - June 11, 2014

Scientists have used carbon nanotubes to create compact terahertz sensors that operate at room temperature.

The technology could make screening bags and passengers at airports less intrusive. It also has the potential to inspect food and even scan for tumors.

Junichiro Kono, a physicist at Rice University, says the potential to replace magnetic resonance imaging (MRI) technology in screening for cancer and other diseases is one of the most exciting possible applications.

(READ COMPLETE ARTICLE)

Country / Region Tags: 
General Topic Tags: 
Problem, Solution, SitRep, or ?: 

Billionaire Jack Dangermond's Esri Pledges $1 Billion Of Mapping Software To America's K-12 Schools

Jack Dangermond of Esri

Image: Jack Dangermond of Esri

forbes.com - Liyan Chen - May 27th 2014

After supporting America’s K-12 and STEM education for more than two decades, billionaire Jack Dangermond is now taking his commitment to the next level by bringing free mapping software to more than 100,000 schools.

Dangermond, the 69-year-old founder and president of the mapping software company Environmental Science Research Institute (known as Esri), announced today that the company will make its advanced mapping software ArcGIS available for free for all the K-12 schools across the country. Through the program, students will now have access to the cloud-based software — the same GIS technology used by governments and businesses — to map and analyze data.

(VIEW COMPLETE ARTICLE)

Country / Region Tags: 
General Topic Tags: 
Problem, Solution, SitRep, or ?: 

White House Builds Open Data Backbone for Climate Resilience


A sampling of maps from the new government website

greenbiz.com - by Christina DeConcini and C. Forbes Tompkins

As communities across America continue to experience increasing climate impacts in the form of rising seas, heat waves and extreme weather, local and federal leaders are starting to roll up their sleeves.

Last week, the White House unveiled the Climate Data Initiative, a project aimed at arming local leaders across the country with information they need to plan for climate impacts while building more resilience. The initiative provides a key tool for helping those at the frontlines of climate change — America’s local communities.

(READ COMPLETE ARTICLE)

NOAA - IBTrACS

Country / Region Tags: 
Problem, Solution, SitRep, or ?: 

Different Network Structures in Twitter Maps


plexusinstitute.org - by Prucia Buscell - March 27, 2014

Twitter conversations create identifiable networks that have structural differences depending on the topic and the influence of dominant individuals. The structures are created as participants in the network choose the people they answer, retweet, and mention in their own messages, according to the Pew Research Internet Project.

The Pew researchers found six identifiable network structures: divided, unified, fragmented, clustered, and inward and outward hub and spoke structures. The report summary contains explanations and examples of teach type.

(READ COMPLETE ARTICLE)

Country / Region Tags: 
Problem, Solution, SitRep, or ?: 

Google, Microsoft, Feds Launch Climate Data Tools


Sea Level Rise Planning Tool

environmentalleader.com - March 20, 2014

Google, Microsoft and other companies joined the White House yesterday to launch a suite of climate data projects designed to serve businesses, governments and the public.

The Climate Data Initiative calls on the private sector to build tools using government datasets, as a number of well-known tech companies are starting to do.

In addition, more than 100 datasets, web services and tools related to coastal flooding and sea level rise are now publicly available at www.data.gov/climate.

(READ COMPLETE ARTICLE)

http://www.data.gov/climate/

Country / Region Tags: 
Problem, Solution, SitRep, or ?: 

FAQ - How do I find a Census tract code for a specific street address?

How do I find a Census tract code for a specific street address?

The Census Bureau offers an Address Search tool in the American FactFinder that allows users to enter an address and then view each level of Census geography, including tract, in which the address is located.  The American FactFinder uses the address ranges in the Census Bureau’s MAF/TIGER database to geocode addresses.

If you are unable to locate your address using the American FactFinder tool, another option is the Federal Financial Institutions Examination Council’s (FFIEC) tool, which uses a commercial database to geocode.

Country / Region Tags: 
General Topic Tags: 
Problem, Solution, SitRep, or ?: 

Pages

Subscribe to Visualization
howdy folks