You are here
USGS Releases New JavaScript Library for Plotting Water Data for the Nation
Primary tabs
submitted by Carrie La Jeunesse
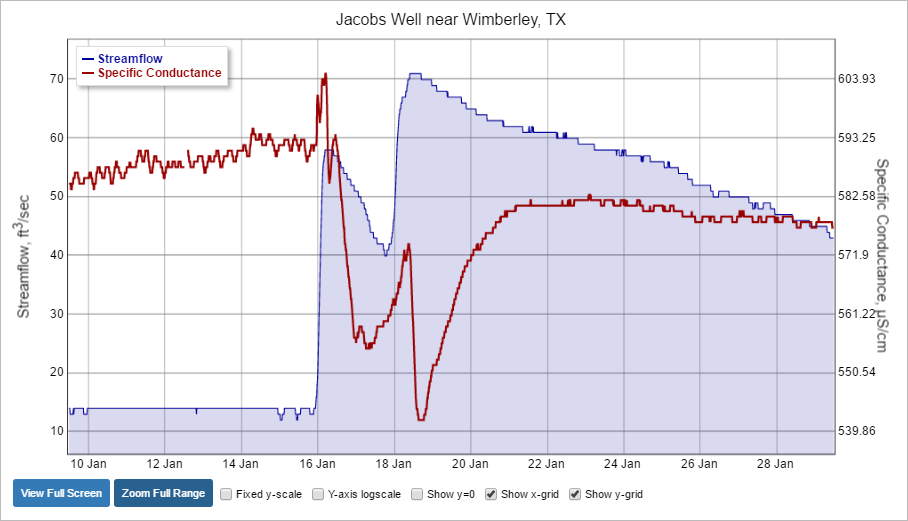
In this example, time-series data for the USGS station at Jacobs Well near Wimberley, Texas (https://waterdata.usgs.gov/nwis/uv?site_no=08170990) is shown from January 9 through 29, 2017. The GWIS plot shows both streamflow and specific conductance in the graph. Double y-axes are used showing how specific conductance changes as streamflow increases.
usgs.gov - February 8, 2017
A new JavaScript library, called GWIS (Graphing Water Information System), can create time-series plots of information measured at U.S. Geological Survey hydrologic data collection sites across the United States.
Developed by the USGS Texas Water Science Center, the user-friendly interface integrates the open-source dygraphs JavaScript charting library with hydrologic data provided by USGS water services.
Using GWIS, one or more interactive plots of any current or historical data available from the USGS Instantaneous (Real-Time) Service or Daily Value Service can easily be inserted into a web page. Plot appearance is customizable, and the plots feature interactive zooming, an interactive legend and optional user controls such as full screen and y-axis log scaling. Multiple plot series, double y-axes and pop-up plots are also supported.


Recent Comments