You are here
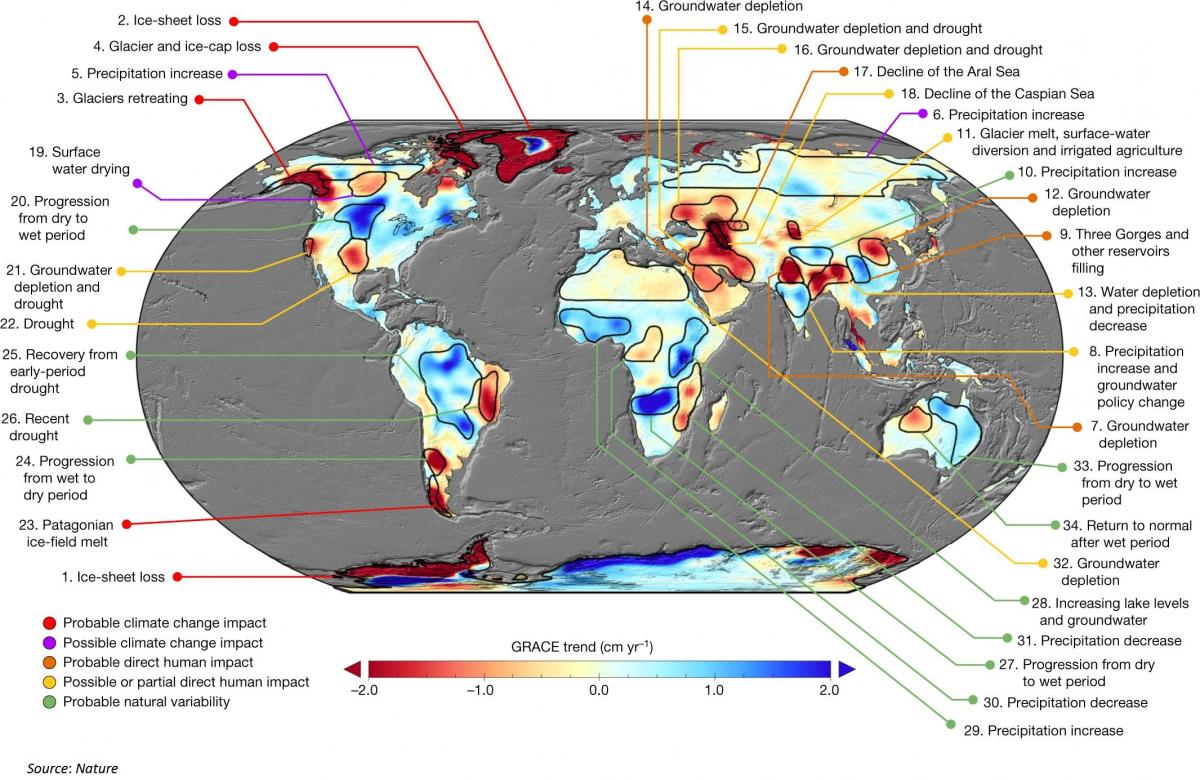
Figure 1: Trends in TWS (in centimetres per year) obtained on the basis of GRACE observations from April 2002 to March 2016. The cause of the trend in each outlined study region is briefly explained and colour-coded by category. The trend map was smoothed with a 150-km-radius Gaussian filter for the purpose of visualization; however, all calculations were performed at the native 3° resolution of the data product.
CLICK HERE - STUDY - Emerging trends in global freshwater availability
trend.pewtrusts.org - by Jay Famiglietti - March 13, 2019
Global changes are altering where and how we get fresh water, sparking the need for worldwide cooperation.
The availability of fresh water is rapidly changing all over the world, creating a tenuous future that requires attention from policymakers and the public . . .
. . . The data quantified the rates at which all regions on Earth are gaining or losing water, allowing my colleagues and me to produce the accompanying map. And what the map shows is also simple to understand but deeply troubling: Water security—a phrase that simply means having access to sufficient quantities of safe water for our daily lives—is at a greater risk than most people realize.
(CLICK HERE - READ COMPLETE ARTICLE)
CLICK HERE - ResearchGate - Emerging trends in global freshwater availability
CLICK HERE - ResearchGate - Figures
CLICK HERE - NASA Satellites Reveal Major Shifts in Global Freshwater
CLICK HERE - IPCC - The Intergovernmental Panel on Climate Change
CLICK HERE - NASA - GRACE Mission: 15 Years of Watching Water on Earth


Recent Comments