You are here

Maps - US

Primary tabs

This working group is focused on discussions about maps.

The mission of this working group is to focus on discussions about maps.

Members

Hank Rappaport Kathy Gilbeaux mdmcdonald

Email address for group

maps-us@m.resiliencesystem.org

How Flood Control Officials Plan To Fix Area Floodplain Maps

Graphic of Texas shows the updated rainfall values in inches that define certain extreme events, such as the 100-year storm. Courtesy of NOAA

CLICK HERE - ENLARGED TEXAS MAP (1 page .PDF file)

New topographic and predictive rainfall data means more people in Harris County will be mapped in floodplains.

houstonpublicmedia.org - by Davis Land - November 26, 2018

When Hurricane Harvey left so much of Houston underwater, it highlighted a problem that’s been getting worse for years: Harris County’s existing floodplain maps just don’t work.

In the year since the historic storm, flood control officials have promised to change that, and they already had plans to redo the maps, but new data on the geography of the area and the amount of rainfall forecasters expect in the future means the new maps could look drastically different.

It’s crucial the maps are done right, as people are using the maps, meant to set flood insurance premiums, for more than they are intended . . . 

Country / Region Tags: 
Problem, Solution, SitRep, or ?: 

US Flood Risk 'Severely Underestimated'


During Hurricane Harvey, Port Arthur in Texas experienced some the most extreme impacts of flooding - Getty Images

Scientists and engineers have teamed up across the Atlantic to "redraw" the flood map of the US.

bbc.com - by Victoria Gill - 11 December 2017

Their work reveals 40 million Americans are at risk of having their homes flooded - more than three times as many people as federal flood maps show.

The UK-US team say they have filled in "vast amounts of missing information" in the way flood risk is currently measured in the country.

They presented the work at the 2017 American Geophysical Union meeting.

(CLICK HERE - READ COMPLETE ARTICLE)

CLICK HERE - 2017 American Geophysical Union meeting


Country / Region Tags: 
Problem, Solution, SitRep, or ?: 

NASA Map of Earth's Seasons Over 20 Years Highlights Climate Change

The visualization shows spring coming earlier and the Arctic ice caps receding over time

NASA - theguardian.com - AP - November 17, 2017

Nasa has captured 20 years of changing seasons in a striking new global map of planet Earth​.

The data visualization, released this week, shows Earth’s fluctuations as seen from space.

(READ COMPLETE ARTICLE)

CLICK HERE - NASA - The Living Planet - The Changing Colors of our Living Planet

CLICK HERE - NASA - Our Living Planet from Space

Country / Region Tags: 
Problem, Solution, SitRep, or ?: 

Facebook Disaster Maps - Using Data to Help Communities Recover and Rebuild

newsroom.fb.com - By Molly Jackman - June 7, 2017

Today, we are introducing disaster maps that use aggregated, de-identified Facebook data to help organizations address the critical gap in information they often face when responding to natural disasters. Many of these organizations worked with us to identify what data would be most helpful and how it could be put to action in the moments following a disaster.

This initiative is the product of close work with UNICEF, the International Federation of the Red Cross and Red Crescent Societies, the World Food Programme, and other organizations. 

(READ COMPLETE ARTICLE)

ALSO SEE RELATED ARTICLE HERE - Surveillance for good? Facebook tracks disaster victims

CLICK HERE - Mark Zuckerberg - Facebook

Country / Region Tags: 
Problem, Solution, SitRep, or ?: 

Maps - Pipelines - Trains that Carry Crude Oil

This map shows the incidents pipeline operators have reported to the Pipeline and Hazardous Materials Safety Administration, known as PHMSA, since 2010.
(Click on the link below, and scroll down)
http://insideenergy.org/2016/11/18/protesters-say-pipelines-are-dangerous-are-they/

The PHMSA makes searchable information about where pipelines are in the U.S., broken down by county, available at its website.
(Click on the link below)
https://pvnpms.phmsa.dot.gov/PublicViewer/

National Pipeline Mapping System
https://www.npms.phmsa.dot.gov

U.S. Department of Transportation - Pipeline and Hazardous Materials Safety Administration - Incident Statistics
http://www.phmsa.dot.gov/hazmat/library/data-stats/incidents

ProPublica - Crude Connections: Where Do Trains Carry Crude Oil?
http://projects.propublica.org/graphics/oil-trains


Country / Region Tags: 
General Topic Tags: 
Problem, Solution, SitRep, or ?: 

How Likely Are You To Deal With A Zika Outbreak? Check This Map

huffingtonpost.com - August 15th 2016 - Anna Almendrala

Now that Zika virus is spreading locally in Florida, U.S. residents, and especially pregnant women, are growing alarmed at the risk that they may face in their own communities. 

A new map estimating the risk of local Zika spread around the globe shows a relatively small likelihood that most of North America and Northern Asia will be affected. By contrast, all the variables are in place for local spread in most of Africa, South and Southeast Asia. 

(VIEW COMPLETE ARTICLE)

Country / Region Tags: 
Problem, Solution, SitRep, or ?: 

CDC - Mapping for Ebola: A Collaborative Effort


cdc.gov - January 14, 2015

One of the difficulties faced by teams responding to the current Ebola outbreak in West Africa is identifying individuals and communities residing in remote areas. Existing maps of these regions either do not exist or are inadequate or outdated. This means that basic data like location of houses, buildings, villages, and roads are not easily accessible, and case finding and contact tracing can be extremely difficult.

To help aid the outbreak response effort, volunteers from around the world are using an open-source online mapping platform called OpenStreetMap (OSM) to create detailed maps and map data of Guinea, Sierra Leone, Liberia, and parts of Mali.

(READ COMPLETE ARTICLE)

Country / Region Tags: 
Problem, Solution, SitRep, or ?: 

President Obama Launches Climate Tools Including 3-D Maps

whitehouse.gov

usatoday.com - by Wendy Koch - July 16, 2014

As part of his plan to help U.S. communities prepare for climate change, President Obama is unveiling initiatives Wednesday that include 3-dimensional mapping to better identify flood risks, landslide hazards and coastal erosion. . .

. . . The U.S. Geological Survey is launching a $13 million 3-D Elevation Program to develop advanced mapping that it says could, among other things, make it quicker to update flood maps and easier to find ideal sites for wind turbines and solar panels. It's relying on lidar (light detection and ranging) technology that uses light from lasers to give the elevation of any spot — from the tree tops to the ground.

(READ COMPLETE ARTICLE)

Country / Region Tags: 
Problem, Solution, SitRep, or ?: 

Map Shows Energy Installations In Extreme Weather’s Path

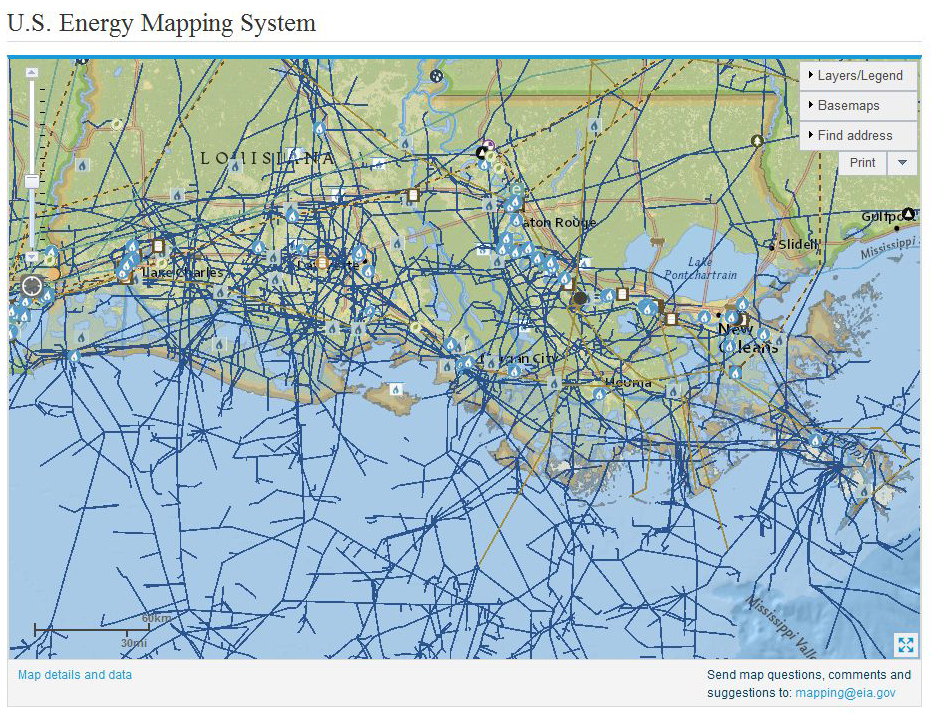
                                (FOR THE INTERACTIVE MAP - CLICK ON THE MAP IMAGE BELOW)


The U.S. Energy Mapping System shows the web of natural gas pipelines, power plants and refineries that spread across the Louisiana Gulf Coast both on and off shore, an area hit hard by Hurricane Katrina in 2005.  Credit: EIA

climatecentral.org - by Bobby Magill - June 12, 2014

Imagine living near the Jersey Shore and a hurricane is barrelling in your direction, or living along the South Platte River in Colorado and an unexpected torrential downpour is flooding the river.

Are there natural gas, oil pipelines or electricity transmission lines that could break and leak in the flood or storm surge? Are oil and gas wells nearby that could flood and leach hydrocarbons into the river?

Those answers can be found online using the U.S. Energy Information Administration's interactive U.S. Energy Mapping System, which shows all the major energy infrastructure for any given address in the U.S.

Country / Region Tags: 
General Topic Tags: 
Problem, Solution, SitRep, or ?: 

Billionaire Jack Dangermond's Esri Pledges $1 Billion Of Mapping Software To America's K-12 Schools

Jack Dangermond of Esri

Image: Jack Dangermond of Esri

forbes.com - Liyan Chen - May 27th 2014

After supporting America’s K-12 and STEM education for more than two decades, billionaire Jack Dangermond is now taking his commitment to the next level by bringing free mapping software to more than 100,000 schools.

Dangermond, the 69-year-old founder and president of the mapping software company Environmental Science Research Institute (known as Esri), announced today that the company will make its advanced mapping software ArcGIS available for free for all the K-12 schools across the country. Through the program, students will now have access to the cloud-based software — the same GIS technology used by governments and businesses — to map and analyze data.

(VIEW COMPLETE ARTICLE)

Country / Region Tags: 
General Topic Tags: 
Problem, Solution, SitRep, or ?: 

Pages

howdy folks