You are here

Map

Here Is How Much You Spend On Electricity In Each State

huffingtonpost.com - August 19th, 2014 - Kevin Short

If you live in Louisiana, you likely use more than twice as much electricity as the average New Yorker does each month. And if you live in Arkansas, you likely pay about half as much as than someone in Vermont does for a unit of electrical power.

The maps below, created using data from the U.S. Energy Information Administration, show how electricity consumption and costs vary across state lines.

(VIEW COMPLETE ARTICLE AND MAPS)

Country / Region Tags: 
General Topic Tags: 
Problem, Solution, SitRep, or ?: 

How citizen scientists use the web to track the natural world

A screenshot of the Frog Watch map.
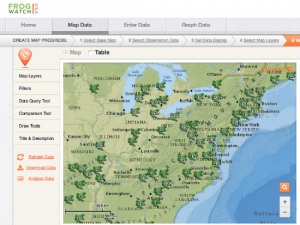
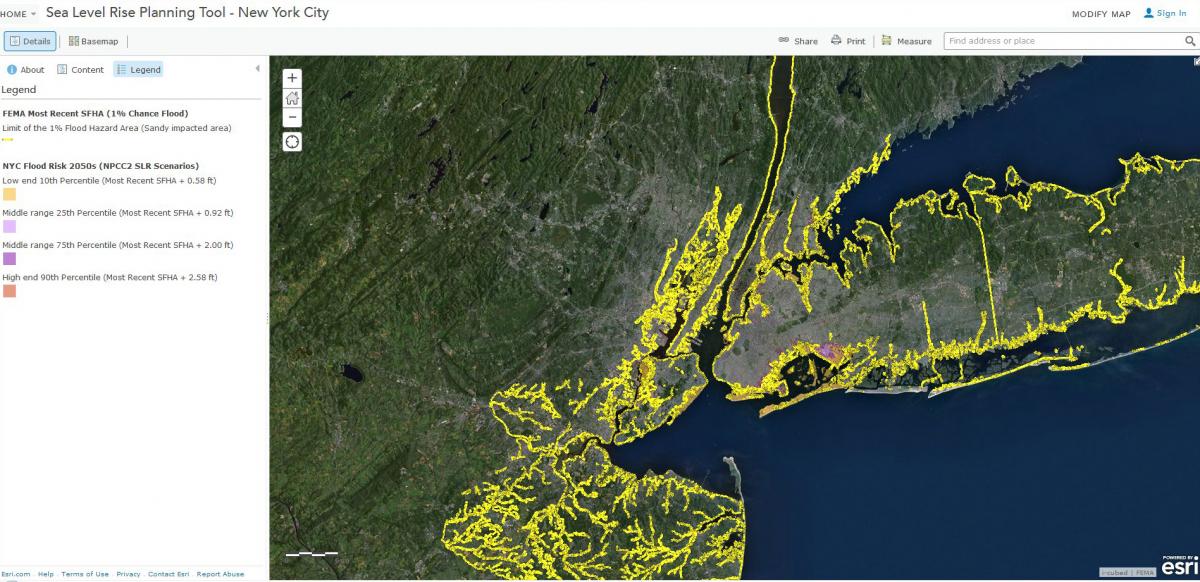
Image: A screenshot of the Frog Watch map.

greenbiz.com - July 8th, 2014 - Yale Environment 360

By making the recording and sharing of environmental data easier than ever, web-based technology has fostered the rapid growth of so-called citizen scientists — volunteers who collaborate with scientists to collect and interpret data. Numerous Internet-based projects now make use of citizen scientists to monitor environmental health and to track sensitive plant and wildlife populations. From counting butterflies, frogs, and bats across the globe, to piloting personal drones capable of high-definition infrared imaging, citizen scientists are playing a crucial role in collecting data that will help researchers understand the environment. Here is a sampling of some of these projects.

(VIEW COMPLETE ARTICLE)

Country / Region Tags: 
General Topic Tags: 
Problem, Solution, SitRep, or ?: 

President Obama Launches Climate Tools Including 3-D Maps

whitehouse.gov

usatoday.com - by Wendy Koch - July 16, 2014

As part of his plan to help U.S. communities prepare for climate change, President Obama is unveiling initiatives Wednesday that include 3-dimensional mapping to better identify flood risks, landslide hazards and coastal erosion. . .

. . . The U.S. Geological Survey is launching a $13 million 3-D Elevation Program to develop advanced mapping that it says could, among other things, make it quicker to update flood maps and easier to find ideal sites for wind turbines and solar panels. It's relying on lidar (light detection and ranging) technology that uses light from lasers to give the elevation of any spot — from the tree tops to the ground.

(READ COMPLETE ARTICLE)

Country / Region Tags: 
Problem, Solution, SitRep, or ?: 

Map Shows Energy Installations In Extreme Weather’s Path

                                (FOR THE INTERACTIVE MAP - CLICK ON THE MAP IMAGE BELOW)


The U.S. Energy Mapping System shows the web of natural gas pipelines, power plants and refineries that spread across the Louisiana Gulf Coast both on and off shore, an area hit hard by Hurricane Katrina in 2005.  Credit: EIA

climatecentral.org - by Bobby Magill - June 12, 2014

Imagine living near the Jersey Shore and a hurricane is barrelling in your direction, or living along the South Platte River in Colorado and an unexpected torrential downpour is flooding the river.

Are there natural gas, oil pipelines or electricity transmission lines that could break and leak in the flood or storm surge? Are oil and gas wells nearby that could flood and leach hydrocarbons into the river?

Those answers can be found online using the U.S. Energy Information Administration's interactive U.S. Energy Mapping System, which shows all the major energy infrastructure for any given address in the U.S.

Country / Region Tags: 
General Topic Tags: 
Problem, Solution, SitRep, or ?: 

White House Builds Open Data Backbone for Climate Resilience


A sampling of maps from the new government website

greenbiz.com - by Christina DeConcini and C. Forbes Tompkins

As communities across America continue to experience increasing climate impacts in the form of rising seas, heat waves and extreme weather, local and federal leaders are starting to roll up their sleeves.

Last week, the White House unveiled the Climate Data Initiative, a project aimed at arming local leaders across the country with information they need to plan for climate impacts while building more resilience. The initiative provides a key tool for helping those at the frontlines of climate change — America’s local communities.

(READ COMPLETE ARTICLE)

NOAA - IBTrACS

Country / Region Tags: 
Problem, Solution, SitRep, or ?: 

Different Network Structures in Twitter Maps


plexusinstitute.org - by Prucia Buscell - March 27, 2014

Twitter conversations create identifiable networks that have structural differences depending on the topic and the influence of dominant individuals. The structures are created as participants in the network choose the people they answer, retweet, and mention in their own messages, according to the Pew Research Internet Project.

The Pew researchers found six identifiable network structures: divided, unified, fragmented, clustered, and inward and outward hub and spoke structures. The report summary contains explanations and examples of teach type.

(READ COMPLETE ARTICLE)

Country / Region Tags: 
Problem, Solution, SitRep, or ?: 

Google, Microsoft, Feds Launch Climate Data Tools


Sea Level Rise Planning Tool

environmentalleader.com - March 20, 2014

Google, Microsoft and other companies joined the White House yesterday to launch a suite of climate data projects designed to serve businesses, governments and the public.

The Climate Data Initiative calls on the private sector to build tools using government datasets, as a number of well-known tech companies are starting to do.

In addition, more than 100 datasets, web services and tools related to coastal flooding and sea level rise are now publicly available at www.data.gov/climate.

(READ COMPLETE ARTICLE)

http://www.data.gov/climate/

Country / Region Tags: 
Problem, Solution, SitRep, or ?: 

FAQ - How do I find a Census tract code for a specific street address?

How do I find a Census tract code for a specific street address?

The Census Bureau offers an Address Search tool in the American FactFinder that allows users to enter an address and then view each level of Census geography, including tract, in which the address is located.  The American FactFinder uses the address ranges in the Census Bureau’s MAF/TIGER database to geocode addresses.

If you are unable to locate your address using the American FactFinder tool, another option is the Federal Financial Institutions Examination Council’s (FFIEC) tool, which uses a commercial database to geocode.

Country / Region Tags: 
General Topic Tags: 
Problem, Solution, SitRep, or ?: 

9 Maps that Illustrate the Struggles of the South


Source: USDA

huffingtonpost.com - by Emily Cohn - March 6, 2014

Look, there are lots of things to love about the South. It's clean and quiet. There's delicious food, good people and often amazing weather. But that's exactly why it makes us so sad to think about all the ways in which the region is struggling today.

First off, poverty rates are a lot higher in the South.

(READ COMPLETE ARTICLE)

Country / Region Tags: 
Problem, Solution, SitRep, or ?: 

Webinar - National Resilience Dashboard Task Force Initiative

February 11, 2014

CLICK HERE - Webinar and Slideshow - National Resilience Dashboard Task Force Initiative

(FOR SLIDESHOW ONLY, CLICK ON THE ATTACHMENT BELOW)

Country / Region Tags: 
General Topic Tags: 
Problem, Solution, SitRep, or ?: 

Pages

Subscribe to Map
howdy folks