You are here

Map

A Picture of Detroit Ruin, Street by Forlorn Street


Leonard Patterson took a picture of a parcel of land on Detroit’s northwest side earlier this month as part of an emerging database. Credit Fabrizio Costantini for The New York Times

nytimes.com - by Monica Davey - February 17, 2014

DETROIT — A midnight blue Chevy rolls slowly down a snow-covered street, an emergency strobe light on its roof and a sign on its side that promises this is “official business.” At each house, business, even vacant lot, workers in the car pause to decide whether someone lives there and what shape the place is in before snapping a photo and beaming it to “mission control” miles away.

All over Detroit, scores of these workers — on some days as many as 75 three-person teams — have been wending their way through the streets since December, cataloging on computer tablets one of this bankrupt city’s most devastating ailments: its tens of thousands of abandoned and dilapidated buildings.

(READ COMPLETE ARTICLE)

Country / Region Tags: 
General Topic Tags: 
Problem, Solution, SitRep, or ?: 

Census Bureau Introduces New Interactive Mapping Tool along with Latest American Community Survey Statistics

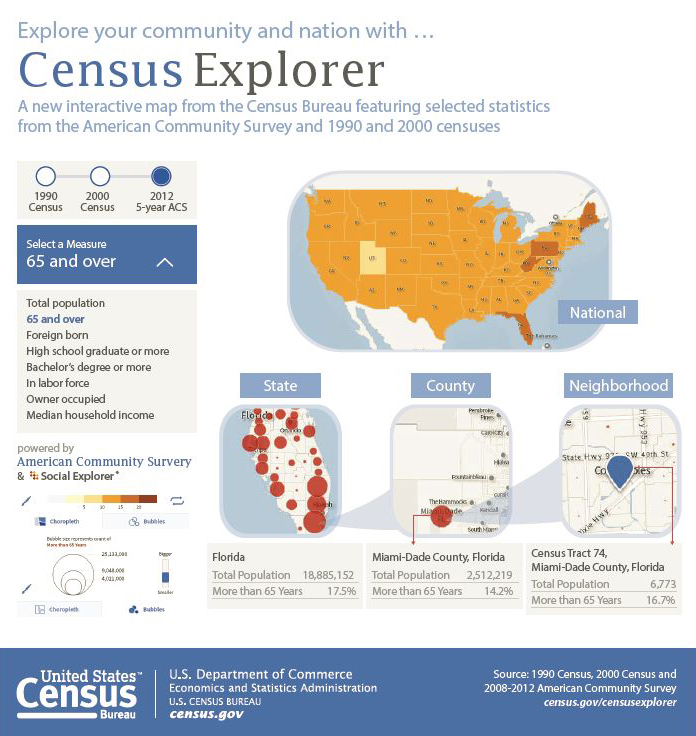
census.gov- December 17, 2013

The U.S. Census Bureau released Census Explorer, a new interactive mapping tool that gives users easier access to neighborhood level statistics. The mapping tool uses updated statistics from the 2008-2012 American Community Survey (ACS), which were also released today.

The new application allows users to map out different social, economic and housing characteristics of their state, county or census tract, and to see how these areas have changed since the 1990 and 2000 censuses. The mapping tool is powered by American Community Survey statistics from the Census Bureau's API, an application programming interface that allows developers to take data sets and reuse them to create online and mobile apps.

(READ COMPLETE ARTICLE)

Country / Region Tags: 
General Topic Tags: 
Problem, Solution, SitRep, or ?: 

Fed Flood Maps Left NY Unprepared for Sandy — and FEMA Knew It

Flooding in Red Hook, Brooklyn after Sandy (Flickr/gunnicool)

The agency ignored state and city officials' appeals to update the maps with better data until it was too late.

wnyc.org - December 6, 2013
by Al Shaw : ProPublica / Theodoric Meyer : ProPublica / Christie Thompson : ProPublica

When Patrice and Philip Morgan bought a house near the ocean in Brooklyn, they were not particularly worried about the threat of flooding.

Federal maps showed their home was outside the area at a high risk of flood damage. . .

. . . But the maps drawn up by the Federal Emergency Management Agency were wrong. And government officials knew it.

(READ COMPLETE ARTICLE)

Country / Region Tags: 
Problem, Solution, SitRep, or ?: 

The Most Efficient Health Care Systems In The World

Huffington Post - Kavitha A. Davidson - August 29, 2013

As supporters and opponents of the Affordable Care Act debate the best way to overhaul a clearly broken health care system, it's perhaps helpful to put American medicine in a global perspective.

The infographic below is based on a recent Bloomberg ranking of the most efficient countries for health care, and highlights enormous gap between the soaring cost of treatment in the U.S. and its quality and effectiveness.

Country / Region Tags: 
General Topic Tags: 
Problem, Solution, SitRep, or ?: 

Fracking Across the United States


View Fraccidents Map in a larger map

Image: A map of fracking accidents in the United States

earthjustice.org

The country is in the midst of an unprecedented oil and gas drilling rush—brought on by a controversial technology called hydraulic fracturing or fracking. Along with this fracking-enabled oil and gas rush have come troubling reports of poisoned drinking water, polluted air, mysterious animal deaths, industrial disasters and explosions. We call them Fraccidents.

(VIEW WEBSITE)

Country / Region Tags: 
Problem, Solution, SitRep, or ?: 

These Interactive Maps Compare 19th Century American Cities to Today

As mind-blowing as science is these days, it's probably safe to say that we're not going to invent a time machine within the next century. Through the magic of code, though, there is an entertaining alternative in the world of interactive maps. Obviously, The Smithsonian is on it.

The magazine recently dipped into David Rumsey's collection of over 150,000 maps to find some of the best representations of American cities over the past couple hundred years. With some simple programming, they were able to overlay images of vintage maps of some major cities onto satellite images from today. The results are fascinating.

See maps of New York City, Denver, Los Angeles, San Francisco, Denver, and Washington, DC

Country / Region Tags: 
General Topic Tags: 
Problem, Solution, SitRep, or ?: 

Probability Maps Help Detect Food Contamination

Sandia's stochastic network metholodogy accelerates spread of food-borne illness // Source: sandia.gov

submitted by Luis Kun

Homeland Security News Wire - October 1, 2012

Researchers demonstrate how developing a probability map of the food supply network using stochastic network representation might shorten the time it takes to track down contaminated food sources; stochastic mapping shows what is known about how product flows through the distribution supply chain and provides a means to express all the uncertainties in potential supplier-customer relationships that persist due to incomplete information

Uncovering the sources of fresh food contamination could become faster and easier thanks to analysis done at Sandia National Laboratories’ National Infrastructure Simulation and Analysis Center (NISAC).

Country / Region Tags: 
General Topic Tags: 
Problem, Solution, SitRep, or ?: 

Future Trends in Geospatial Information Management: The Five to Ten Year Vision

submitted by Samuel Bendett

United Nations Initiative on Global Geospatial Information Management - April 24, 2012

A working group was established to assess the future trends in geospatial information management at the 1st meeting of the UN Committee on GGIM in Seoul, Korea. Chaired by Dr. Vanessa Lawrence, Director General and Chief Executive of Ordnance Survey, the working group has received written inputs from 29 persons or institutions. A summary of the future trends shall be presented during this forum in Amsterdam, followed by discussion among all the participants. Meanwhile, the process of soliciting views on future trends continue and the working group welcomes any additional inputs. A consolidated paper on the future trends shall be discussed in the 2nd Session of the Committee of Experts on Global Geospatial Information Management.

http://ggim.un.org/

Background paper:
Future trends in geospatial information management: the five to ten year vision (8 page .PDF file)


Country / Region Tags: 
General Topic Tags: 
Problem, Solution, SitRep, or ?: 

Map Your Neighborhood

General Topic Tags: 
Problem, Solution, SitRep, or ?: 

Map Your Neighborhood” (MYN) is a program designed to help neighborhoods prepare for disasters and is offered through many local emergency management offices.

Pages

Subscribe to Map
howdy folks