User login
Language
Anonymous's groups in this site
User is not a member of any group.
Your groups across all your sites
User is not a member of any group.
Recent Content
Who's online
There are currently 0 users online.
You are here
Map - Global Forest Watch Fires
Thu, 2019-08-22 09:00 — Kathy Gilbeauxfires.globalforestwatch.org
Global Forest Watch Fires (GFW Fires) is an online platform for monitoring and responding to forest and land fires using near real-time information. GFW Fires can empower people to better combat harmful fires before they burn out of control and hold accountable those who may have burned forests illegally.
GFW Fires combines real-time satellite data from NASA’s Active Fires system, high resolution satellite imagery, detailed maps of land cover and concessions for key commodities such as palm oil and wood pulp, weather conditions and air quality data to track fire activity and related impacts in the South East Asia region. GFW Fires also offers on-the-fly analysis to show where fires occur, and help understand who might be responsible.
By working with national and local governments, NGOs, corporations, and individuals, GFW Fires is working to quicken fire response time, ramp up enforcement against illegal fires, help ensure those who are illegally burning are held accountable, and coordinate relationships between government agencies.
(CLICK HERE - READ COMPLETE ARTICLE)
National Storm Surge Hazard Maps
Tue, 2019-04-30 08:31 — Kathy GilbeauxThis national depiction of storm surge flooding vulnerability helps people living in hurricane-prone coastal areas along the U.S. East and Gulf Coasts, Puerto Rico, U.S. Virgin Islands (USVI), Hawaii, and Hispaniola to evaluate their risk to the storm surge hazard. These maps make it clear that storm surge is not just a beachfront problem, with the risk of storm surge extending many miles inland from the immediate coastline in some areas. If you discover via these maps that you live in an area vulnerable to storm surge, find out today if you live in a hurricane storm surge evacuation zone as prescribed by your local emergency management agency. If you do live in such an evacuation zone, decide today where you will go and how you will get there, if and when you're instructed by your emergency manager to evacuate. If you don't live in one of those evacuation zones, then perhaps you can identify someone you care about who does live in an evacuation zone, and you could plan in advance to be their inland evacuation destination – if you live in a structure that is safe from the wind and outside of flood-prone areas.
National Hurricane Center - National Storm Surge Hazard Maps - Version 2
https://www.nhc.noaa.gov/nationalsurge/
Cal Fire - California Fire Map - 2018 Statewide Incidents Map
Sun, 2018-07-29 09:07 — Kathy GilbeauxZika Cases 2015/2016 United States, Territories, Canada
Thu, 2018-03-22 13:00 — Kathy GilbeauxMap of imported and locally acquired Zika virus in United States, territories, and Canada.
https://www.google.com/maps/d/embed?mid=1FlIB7hHnVgGD9TlbSx5HwAj-PEQ&hl=en
Facebook Disaster Maps - Using Data to Help Communities Recover and Rebuild
Thu, 2017-06-08 15:59 — Kathy Gilbeauxnewsroom.fb.com - By Molly Jackman - June 7, 2017
Today, we are introducing disaster maps that use aggregated, de-identified Facebook data to help organizations address the critical gap in information they often face when responding to natural disasters. Many of these organizations worked with us to identify what data would be most helpful and how it could be put to action in the moments following a disaster.
This initiative is the product of close work with UNICEF, the International Federation of the Red Cross and Red Crescent Societies, the World Food Programme, and other organizations.
ALSO SEE RELATED ARTICLE HERE - Surveillance for good? Facebook tracks disaster victims
Maps - Pipelines - Trains that Carry Crude Oil
Sat, 2017-01-28 11:56 — Kathy GilbeauxThis map shows the incidents pipeline operators have reported to the Pipeline and Hazardous Materials Safety Administration, known as PHMSA, since 2010.
(Click on the link below, and scroll down)
http://insideenergy.org/2016/11/18/protesters-say-pipelines-are-dangerous-are-they/
The PHMSA makes searchable information about where pipelines are in the U.S., broken down by county, available at its website.
(Click on the link below)
https://pvnpms.phmsa.dot.gov/PublicViewer/
National Pipeline Mapping System
https://www.npms.phmsa.dot.gov
U.S. Department of Transportation - Pipeline and Hazardous Materials Safety Administration - Incident Statistics
http://www.phmsa.dot.gov/hazmat/library/data-stats/incidents
ProPublica - Crude Connections: Where Do Trains Carry Crude Oil?
http://projects.propublica.org/graphics/oil-trains
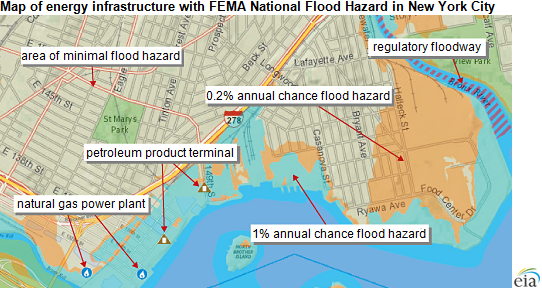
Energy Infrastructure - Flood Vulnerability Assessment Map
Sat, 2014-08-16 22:43 — Kathy Gilbeauxsubmitted by Sarah Slaughter
Source: U.S. Energy Information Administration
eia.gov - August 6, 2014
A new component of EIA's Energy Mapping System allows users to view critical energy infrastructure that may be vulnerable to coastal and inland flooding. These new map layers enable the public to see existing energy facilities that could potentially be affected by flooding caused by hurricanes, overflowing rivers, flash floods, and other wet-weather events.
The mapping tool combines flood hazard information from the Federal Emergency Management Agency (FEMA) with EIA's existing U.S. Energy Mapping System that shows power plants, oil refineries, crude oil rail terminals, and other critical energy infrastructure. The maps can help readers understand what energy infrastructure assets are currently exposed to flood risk.
(CLICK HERE - Energy Infrastructure with FEMA National Flood Hazard)
U.S. Energy Mapping System
Fri, 2014-02-14 17:00 — Kathy Gilbeaux(CLICK ON THE MAP IMAGE BELOW)
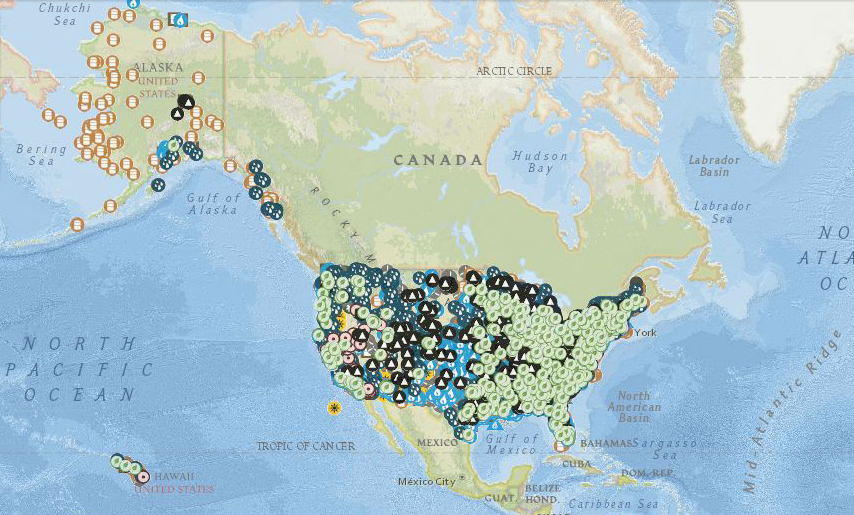
U.S. Energy Information Administration - eia.gov
The U.S. Energy Information Administration (EIA) collects, analyzes, and disseminates independent and impartial energy information to promote sound policymaking, efficient markets, and public understanding of energy and its interaction with the economy and the environment.
Mission and Overview
The U.S. Energy Information Administration (EIA) is the statistical and analytical agency within the U.S. Department of Energy. EIA collects, analyzes, and disseminates independent and impartial energy information to promote sound policymaking, efficient markets, and public understanding of energy and its interaction with the economy and the environment. EIA is the nation's premier source of energy information and, by law, its data, analyses, and forecasts are independent of approval by any other officer or employee of the U.S. Government.
EIA conducts a comprehensive data collection program that covers the full spectrum of energy sources, end uses, and energy flows. EIA also prepares informative energy analyses, monthly short-term forecasts of energy market trends, and long-term U.S. and international energy outlooks. EIA disseminates its data, analyses, and other products primarily through its website and customer contact center.
The Department of Energy Organization Act of 1977 established EIA as the primary federal government authority on energy statistics and analysis, building upon systems and organizations first established in 1974 following the oil market disruption of 1973. Located in Washington, DC, EIA is an organization of about 370 federal employees, with an annual budget in Fiscal Year 2013 of $99.5 million.
US map
Thu, 2011-05-05 20:40 — Mikayla McDonaldUS Map
Recent Comments