User login
Language
Anonymous's groups in this site
User is not a member of any group.
Your groups across all your sites
User is not a member of any group.
Recent Content
Who's online
There are currently 0 users online.
You are here
State-by- State graphs on COVID-19 Vaccination progress
Mon, 2021-03-08 12:23 — mike kraft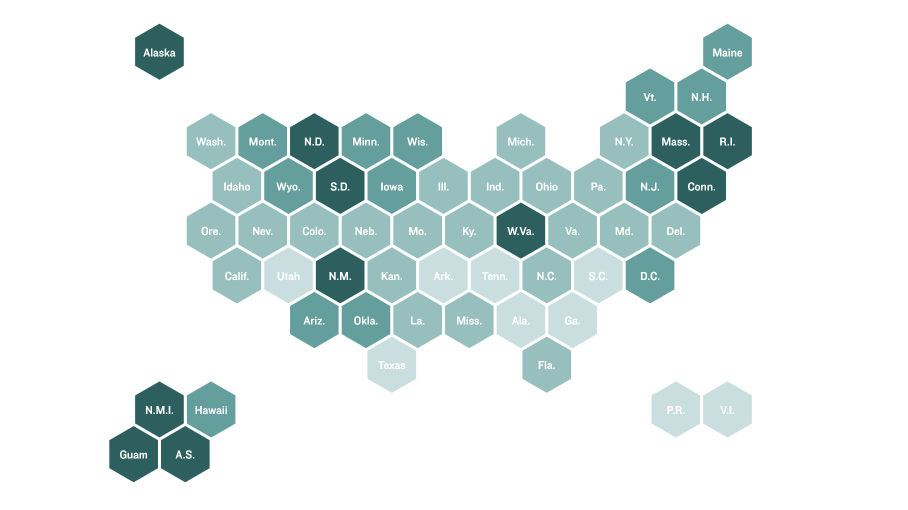
The U.S. is working to vaccinate a high percentage of its population against COVID-19 as soon as possible to stop the spread of the disease and end the outbreak in the country.
The mission becomes even more urgent as coronavirus variants emerge around the world, raising concerns that the virus could evade our efforts to control it, if the spread is not curbed quickly.
Since vaccine distribution began in the U.S. on Dec. 14, more than 90 million doses have been administered, reaching 17.7% of the total U.S. population, according to federal data collected by the Centers for Disease Control and Prevention. The U.S. is currently administering over 2.2 million shots a day.
Recent Comments